 Development Practices
Conference50min
Finding Java Memory Leaks
A practical deep dive into Java memory leaks: how they happen, how to detect and fix them with JDK 25 tools, and how to use profilers, heap dumps, and JFR. Includes live demos, common leak patterns, and best practices for preventing production issues.
talk.summaryAiDisclaimer
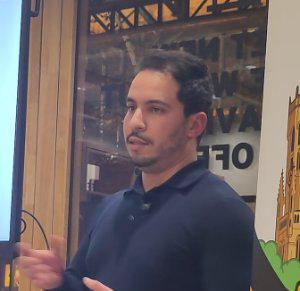
Badr KacimiBlue Harvest
talkDetail.whenAndWhere
Thursday, November 5, 10:30-11:20
TBA 2
talks.roomOccupancytalks.noOccupancyInfo
This talk provides a practical and engaging deep dive into how memory leaks occur in Java applications and how to detect, analyze, and fix them using modern tools available in JDK 25, guiding the audience through JVM memory architecture, GC Roots, and common leak patterns such as unbounded caches and mismanaged ThreadLocals, illustrated with a live demo using the IntelliJ Profiler and heap dumps captured via JFR, jcmd, and automatic OOM triggers; by the end of the session, attendees primarily Java developers, backend engineers, and performance‑focused practitioners will walk away with a clear mental model of JVM memory behavior, hands‑on diagnostic techniques, and practical best practices to prevent leaks in production systems.
Badr Kacimi
Badr Kacimi is a Senior Consultant at Blue Harvest Belgium and ABN AMRO Bank in the Netherlands, where he designs and develops advanced analytical financial risk models. His day‑to‑day work spans the JVM/Spring and Python ecosystems, and he increasingly serves as a trusted advisor to Blue Harvest’s clients on technology strategy and engineering best practices.
Badr is an active member and contributor to the technology community, regularly sharing knowledge and insights at conferences and user groups, including: • BeJUG (Belgium Java User Group) • BruJUG (Brussels Java User Group) • Voxxed Days Luxembourg • Microsoft Foundry & Azure User Group Utrecht • Devoxx Belgium Reviewer
Badr is an active member and contributor to the technology community, regularly sharing knowledge and insights at conferences and user groups, including: • BeJUG (Belgium Java User Group) • BruJUG (Brussels Java User Group) • Voxxed Days Luxembourg • Microsoft Foundry & Azure User Group Utrecht • Devoxx Belgium Reviewer